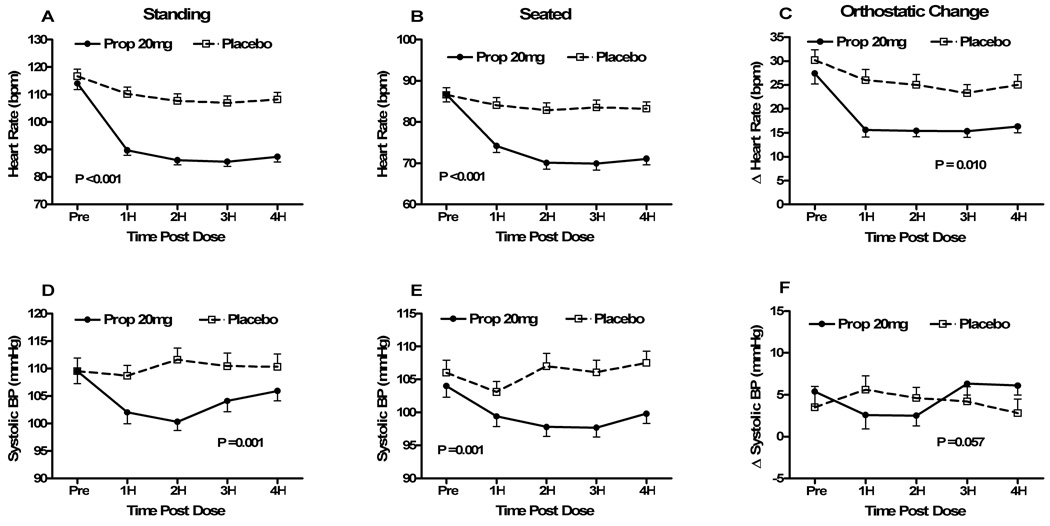
Figure 1. Seated, standing and orthostatic changes in heart rates and blood pressures before and after propranolol 20mg vs. placebo (Protocol #1).
Heart rate (HR) and systolic blood pressure (SBP) data are presented immediately before (pre), and hourly for 4 hours (4H) following study drug administration for the propranolol 20mg day (“Prop 20”; solid circles) and the placebo day (open squares). Peak HR after standing for a maximum of 10 minutes (Fig 1A), seated HR immediately before standing (Fig 1B) and the changes in HR from sit to stand (Fig 1C) are shown in the top 3 panels. Similarly, the data for standing SBP (Fig 1D), seated SBP (Fig 1E) and the changes in SBP from sit to stand (Fig 1F) are shown in the bottom 3 panels. The error bars represent the standard error of the mean. The ANOVA P values are presented for the overall effect of the study drug over time. bpm – beats per minute; mmHg – millimeters of mercury.

