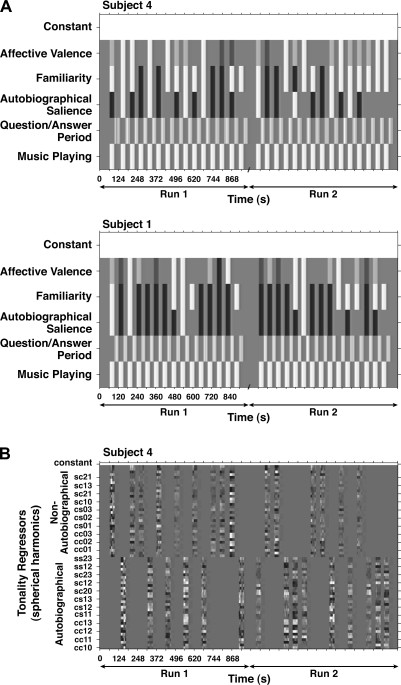
Figure 1.
Design matrices for 2 subjects illustrate the statistical models that were used. The grayscale codes the regressor values, with black representing the most negative values and white the most positive. The ubiquitous gray represents zero. (A) The 30 s music epochs alternated with the question/answer periods during which subjects responded to questions on multipoint scales. Those answers were used to code parametrically varying regressors for autobiographical salience, familiarity, and affective valence. Black bars represent song excerpts that were unfamiliar or not autobiographically salient, whereas white bars represent songs that were familiar and strongly autobiographically salient. Valence ratings range from very displeasing (black) to very pleasing (white) with neither pleasing nor displeasing represented by zero. (B) A design matrix for a single subject with 2 sets of regressors that model the movement of each piece of music through tonal space. A set of 34 spherical harmonics is used to model the movements. One set was used to model those songs marked as autobiographically salient and another to mark songs that were not. Thus, the model tests an interaction of tonality tracking and autobiographical salience.

