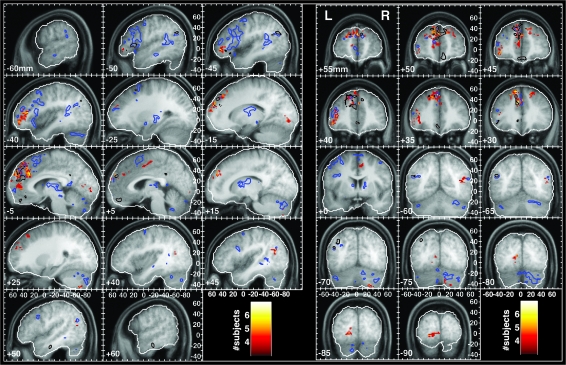
Figure 5.
A summary of brain areas exhibiting TT behavior. The color of each voxel indicates the number of subjects in whom that voxel showed significant TT behavior. A Monte Carlo simulation determined the likelihood of a given number of subjects showing TT at any given voxel by chance alone. The probabilities were P < 0.014, P < 0.0015, and P < 0.0001 for 4, 5, and 6 subjects, respectively. The blue and black contours demarcate the borders of the individual familiarity and autobiographical salience activations shown in Figure 3, respectively.

