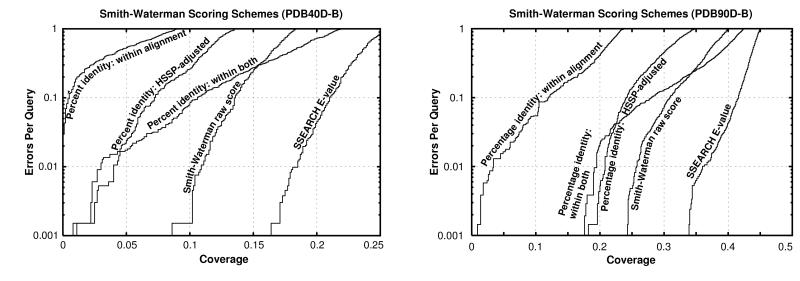
Figure 1.
Coverage vs. error plots of different scoring schemes for ssearch Smith–Waterman. (A) Analysis of pdb40d-b database. (B) Analysis of pdb90d-b database. All of the proteins in the database were compared with each other using the ssearch program. The results of this single set of comparisons were considered using five different scoring schemes and assessed. The graphs show the coverage and errors per query (EPQ) for statistical scores, raw scores, and three measures using percentage identity. In the coverage vs. error plot, the x axis indicates the fraction of all homologs in the database (known from structure) which have been detected. Precisely, it is the number of detected pairs of proteins with the same fold divided by the total number of pairs from a common superfamily. pdb40d-b contains a total of 9,044 homologs, so a score of 10% indicates identification of 904 relationships. The y axis reports the number of EPQ. Because there are 1,323 queries made in the pdb40d-b all-vs.-all comparison, 13 errors corresponds to 0.01, or 1% EPQ. The y axis is presented on a log scale to show results over the widely varying degrees of accuracy which may be desired. The scores that correspond to the levels of EPQ and coverage are shown in Fig. 4 and Table 1. The graph demonstrates the trade-off between sensitivity and selectivity. As more homologs are found (moving to the right), more errors are made (moving up). The ideal method would be in the lower right corner of the graph, which corresponds to identifying many evolutionary relationships without selecting unrelated proteins. Three measures of percentage identity are plotted. Percentage identity within alignment is the degree of identity within the aligned region of the proteins, without consideration of the alignment length. Percentage identity within both is the number of identical residues in the aligned region as a percentage of the average length of the query and target proteins. The hssp equation (17) is H = 290.15l−0.562 where l is length for 10 < l < 80; H > 100 for l < 10; H = 24.7 for l > 80. The percentage identity hssp-adjusted score is the percent identity within the alignment minus H. Smith–Waterman raw scores and E-values were taken directly from the sequence comparison program.

