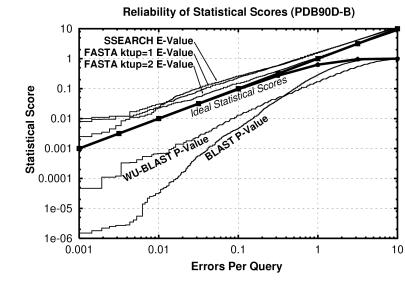
Figure 4.
Reliability of statistical scores in pdb90d-b: Each line shows the relationship between reported statistical score and actual error rate for a different program. E-values are reported for ssearch and fasta, whereas P-values are shown for blast and wu-blast2. If the scoring were perfect, then the number of errors per query and the E-values would be the same, as indicated by the upper bold line. (P-values should be the same as EPQ for small numbers, and diverges at higher values, as indicated by the lower bold line.) E-values from ssearch and fasta are shown to have good agreement with EPQ but underestimate the significance slightly. blast and wu-blast2 are overconfident, with the degree of exaggeration dependent upon the score. The results for pdb40d-b were similar to those for pdb90d-b despite the difference in number of homologs detected. This graph could be used to roughly calibrate the reliability of a given statistical score.

