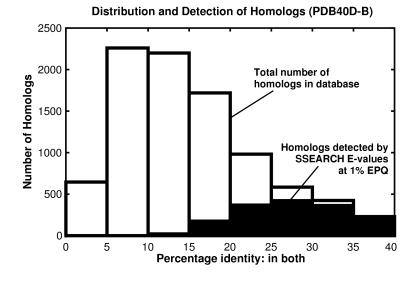
Figure 6.
Distribution and detection of homologs in pdb40d-b. Bars show the distribution of homologous pairs pdb40d-b according to their identity (using the measure of identity in both). Filled regions indicate the number of these pairs found by the best database searching method (ssearch with E-values) at 1% EPQ. The pdb40d-b database contains proteins with <40% identity, and as shown on this graph, most structurally identified homologs in the database have diverged extremely far in sequence and have <20% identity. Note that the alignments may be inaccurate, especially at low levels of identity. Filled regions show that ssearch can identify most relationships that have 25% or more identity, but its detection wanes sharply below 25%. Consequently, the great sequence divergence of most structurally identified evolutionary relationships effectively defeats the ability of pariwise sequence comparison to detect them.

