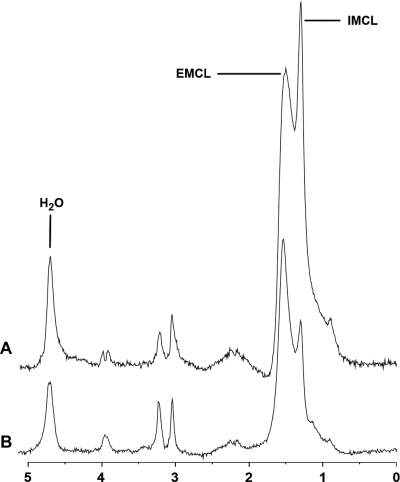
Figure 1.
1H-MRS of soleus muscle obtained at 3.0 T from a subject with obesity (A) (BMI, 33 kg/m2) and age-matched normal-weight control (B) (BMI, 19 kg/m2). The obese subject shows relatively higher IMCL and EMCL resonances consistent with higher lipid content. IMCL, IMCL methylene protons at 1.3 ppm; EMCL, EMCL methylene protons at 1.5 ppm; H2O, residual water signal.

