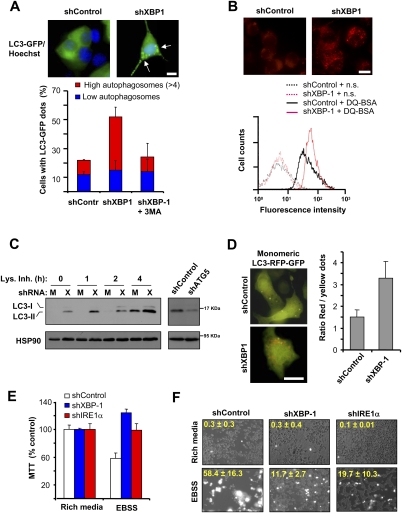
Figure 3.
Inhibition of XBP-1 expression increases the levels of basal autophagy. (A) Number of cells with autophagosomes was quantified by confocal microscopy in shControl or shXBP-1 NSC34 cells after expressing a LC3-EGFP expression vector. Cells were classified into two groups: those that contained low LC3-EGFP dots or those that contained more than four LC3-EGFP dots. As control, cells were treated for 16 h with 10 mM 3-MA. (Top panel) Representative images of LC3-EGFP-positive vacuoles (arrows). Bar, 10 μm. Average and standard deviation are presented of three determinations. (B) To monitor the proteolytic activity of lysosomes, shXBP-1 and shControl cells were loaded with DQ-BSA for 16 h and analyzed by FACS to monitor the dequenching of the dye associated with lysosomal degradation. (n.s.) Nonstained cells. (Top panel) Representative images of DQ-BSA staining are presented. Bar, 10 μm. (C) Basal levels of the endogenous lipidated LC3-II form were monitored by Western blot in shControl (M) or shXBP-1 (X) cells under resting conditions. To monitor the flux of LC3 through the autophagy pathway, experiments were performed in the presence or absence of a lysosome inhibitor cocktail (Lys. Inh.) containing 200 nM bafilomycin A1, 10 μg/mL pepstatin, and 10 μg/mL E64d for the indicated time points. (Right panel) As control, in shXBP-1 NSC34 cells, ATG5 was also knocked down with shRNAs and LC3-II levels were monitored by Western blot. (D) shControl and shXBP-1 cells were transiently transfected with a tandem monomeric LC3-RFP-GFP construct to monitor the active flux of LC3 though the autophagy pathway. After 48 h, LC3-positive dots were visualized by fluorescent microscopy in the red and green channels and the ratio between the number of red dots (autophagolysosomes, acidic compartment) versus colocalized yellow dots (representing autophagosomes) per cell was determined. Mean and standard deviation are presented. Representative overlapped fluorescent images are presented. Bar, 10 μm. (E,F) shControl, shXBP-1, and shIRE1α cells were maintained in rich culture medium or incubated in EBSS buffer for 2 h, and mitochondrial metabolism was determined using the MTT assay (E) or cell viability was monitored by propidium iodide staining (F). Overlapping phase contrast and propidium iodide staining images are shown. Average and standard deviation are presented of three to five determinations.

