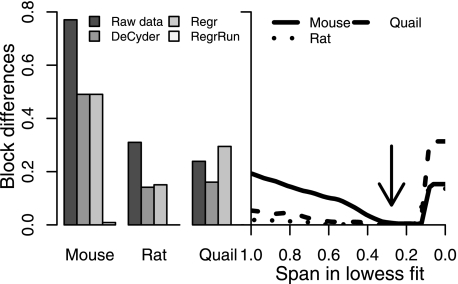
Fig. 5.
The fractions of peaks with statistically significant (p < 0.05) interblock differences using raw, DeCyder-, and Regr-normalized data in the three data sets (left panel) are shown. The fractions decreased (Mouse and Rat) after normalizing the data using the DeCyder and Regr methods. Using the RegrRun method with default Lowess span setting (0.3; indicated by the arrow) resulted, in principle, in no peaks displaying significant interblock differences (left and right panels). Span settings <0.15 resulted in increased interblock differences due to overfitting.

