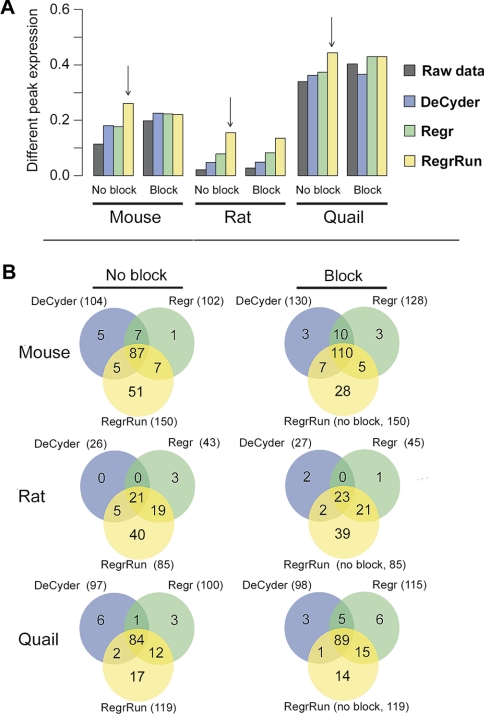
Fig. 7.
The number of differentially expressed peaks in the Mouse, Rat, and Quail data sets using the RegrRun method compared with raw, DeCyder-, and Regr-normalized data (p < 0.05). The largest fraction of differentially expressed peaks was found in the RegrRun-normalized data (panel A, vertical arrows). For raw, DeCyder-, and Regr-normalized data the numbers of differentially expressed peaks were calculated both with and without including the block term in the linear model. The largest number of overlapping peaks compared with the RegrRun method was found when including the block term for raw, DeCyder-, and Regr-normalized data (panel B).

