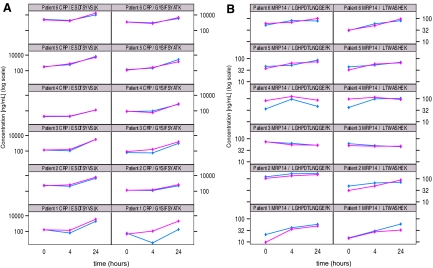
Fig. 2.
Quantitation of moderately abundant proteins in patient plasma samples. Line plots of log(concentration) versus time of CRP (A) and MRP14 (B) at baseline and 4 and 24 h post injury as measured by MRM assay with two different signature peptides for each protein across six patients. Pink and blue traces indicate two different process replicates for each patient and time point.

