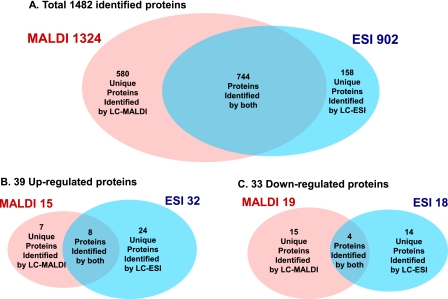
Fig. 2.
Venn diagrams of the number of total (A), up-regulated (B), and down-regulated (C) proteins identified by iTRAQ. A, in total, 1,482 proteins of all taxonomies listed in supplemental Table 1 were identified with a confidence limit of 95%. B and C, for quantification of each protein identified by MALDI or ESI, a -fold change of each protein expression was calculated by comparing the average iTRAQ ratio of 116 and 117 as NGF-treated groups with the average ratio of 114 and 115 as control groups. Proteins quantified with a -fold change more than 20% (average iTRAQ ratio >1.20 or <0.83) and a p value less than 0.05 by MALDI or ESI were identified as differentially expressed proteins (B and C).

