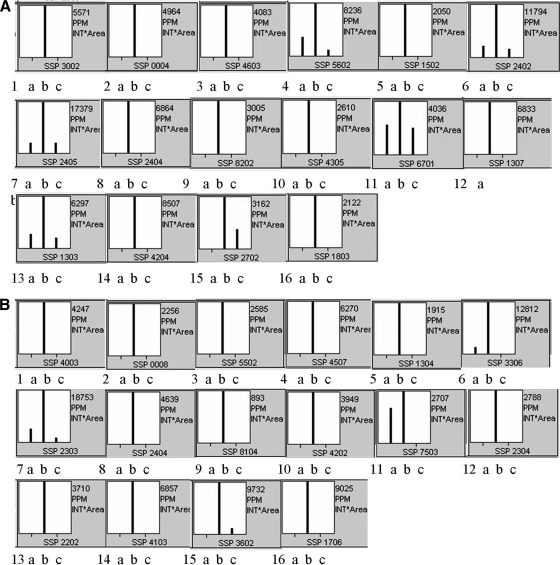
Fig. 2.
Quantitative image analysis of the proteins performed by PDQuest 2-D Analysis Software (Bio-Rad) in 72-h-old (A) and 96-h-old (B) cultures. Numbers underneath each plot correspond to the protein ID in Fig. 1 and Table I. The bars represent the relative amount of the different proteins in the strains in the order of B-2682 (a), AFN (b), and AFN/pSGF4 (c).

