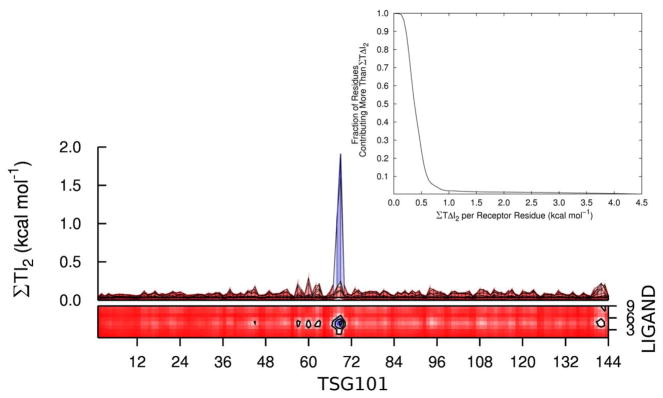
Figure 5.
The main figure shows the top and side views of a contour plot of the peptide-Tsg101 pairwise mutual information contributions, summed by residue and reported as T I2 (kcal mol −1). The inset provides the cumulative distribution of the fraction of Tsg101 residues contributing a mutual information, summed over peptide residues, greater than a given value of T ΔI2.

