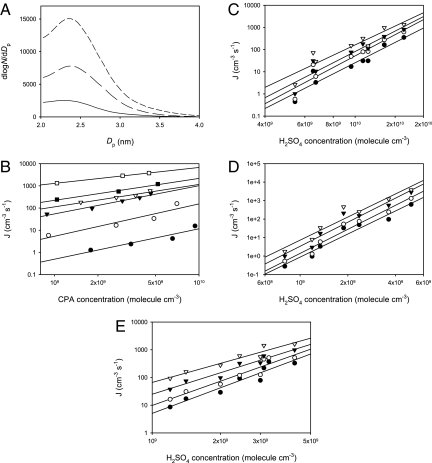
Fig. 1.
New particle formation in the presence of CPA, H2SO4, and H2O. (A) Size distribution of newly nucleated particles. The concentration of H2SO4 was ≈3 × 10⁹ molecule cm−3, and the relative humidity (RH) was at 20%. The concentration of CPA was 7.2 × 10⁹ molecule cm−3 for top curve (short dashed line), 4.9 × 10⁹ molecule cm−3 for middle curve (long-dashed line), and zero for bottom curve (solid line). (B) Nucleation rate (J) as a function of CPA concentrations at 13% RH. For the lines from top to bottom, the H2SO4 concentration varied from 5 × 10⁹ (open squares), 3.6 × 10⁹ (solid squares), 2.4 × 10⁹ (open triangles), 1.9 × 10⁹ (solid triangles), 1.3 × 10⁹ (open circles) to 0.8 × 10⁹ molecule cm−3 (solid circles). (C–E) Nucleation rate as a function of the H2SO4 concentration at RH of 6% (C), 13% (D), and 20% (E). For the lines from top to bottom in C, the CPA concentration varied from 2.1 × 10⁹ (open triangles), 1.1 × 10⁹ (solid triangles), and 5.4 × 10⁸ molecule cm−3 (open circles) to zero (solid circles). For the lines from top to bottom in D, the CPA concentration varied from 6.1 × 10⁹ (open triangles), 4.0 × 10⁹ (solid triangles), and 1.4 × 10⁹ molecule cm−3 (open circles) to zero (solid circles). For the lines from top to bottom in E, the CPA concentration varied from 7.1 × 10⁹ (open triangles), 4.9 × 10⁹ (solid triangles), and 1.7 × 10⁹ molecule cm−3 (open circles) to zero (solid circles). All experiments were performed at 284 ± 2 K and a total pressure of 760 Torr.

