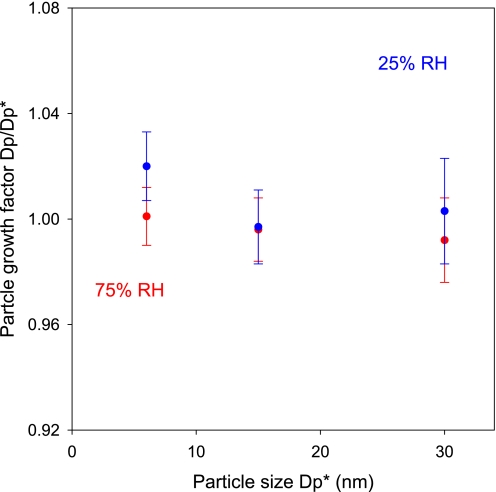
Fig. 4.
Growth factor (Dp/Dp*) of particles on exposure to ammonia under different RH conditions, where Dp* denotes the initial particle size selected by the first nano-DMA, and Dp represents the particle size measured by the second nano-DMA after exposure. The exposure time was ≈30 s. The gaseous concentration of ammonia was 3 × 10¹⁴ molecule cm−3. The experiments were performed at 2 RH conditions, i.e., 25% (blue) and 75% (red), 298 ± 2 K, and 760 Torr. The vertical bars represented the random error of the measurements (2 σ), and the values were averaged over at least three measurements.

