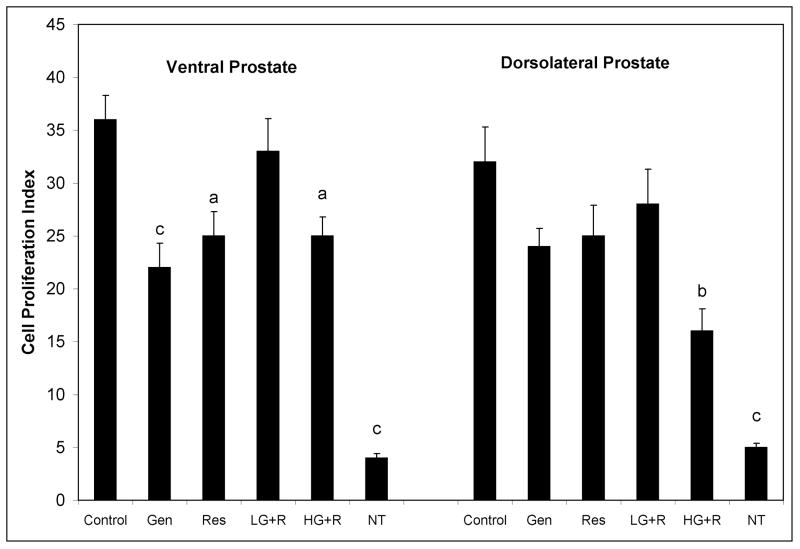
Figure 1.
Cell proliferation as determined by immunohistochemical staining of Ki-67 in ventral and dorsolateral prostate lobes of 12 week old SV-40 Tag rats and non-transgenic rats. SV-40 Tag rats were fed control AIN-76A diet (Cntr), 250 mg genistein/kg diet (Gen), 250 mg resveratrol/kg diet (Res), 83 mg genistein/kg diet + 83 mg resveratrol/kg diet (L-G+R), 250 mg genistein/kg diet + 250 mg resveratrol/kg diet (H-G+R), or non-transgenic rats (NT) were fed control diet starting at birth. Values are presented as total number of Ki-67 staining epithelial cells divided by total number of epithelial cells X 100 ± SEM. Each group contained eight samples. aP < 0.05, bP < 0.01 and cP < 0.001 when compared to control treatment (Cntr) by One-Way ANOVA followed by the Tukey test.

