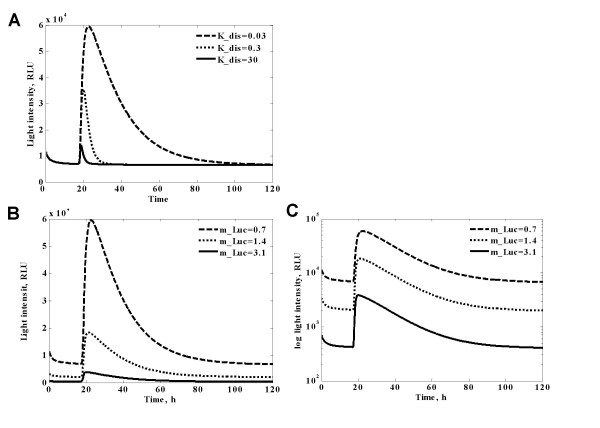
Figure 7.
Investigation of the crucial parameters by simulation of the model. A. Simulation of different stability of Pr_FHL intermediate state. Dashed line corresponds to initial value of dissociation constant K_dis, derived from fitting to the experimental curves. Dotted line corresponds to 10 time's faster Pr_FHL complex dissociation. Solid line corresponds to 100-times faster complex dissociation. B. Simulation of different stability of Luc reporter. Dashed line corresponds to initial value of degradation rate constant m_luc, derived from fitting to experimental data. Dotted line corresponds to twice faster degradation rate of luciferase. Solid line corresponds to more than 4-times faster degradation rate. C. Same as B, but in semilog scale. Reporter instability affects the amplitude of the signal but not the overall timing of events

