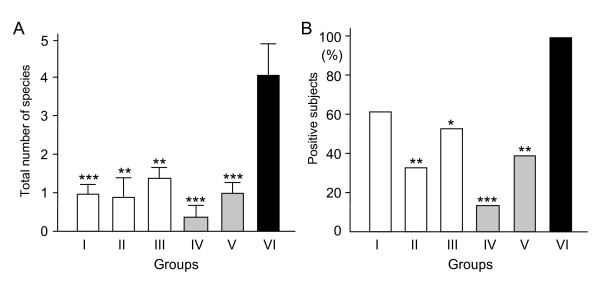
Figure 3.
Correlation of detection of periodontopathic species with general conditions. Average number of the 10 tested species (A) and rate of subjects with at least 1 of those species (B). Group I, mental retardation (MR) (n = 60); Group II, cerebral palsy (CP) (n = 16); Group III, autism (AU) (n = 28); Group IV, MR/CP, (concomitant MR and CP) (n = 17); Group V, concomitant MR/AU (n = 32); Group VI, concomitant MR/CP/AU (n = 7). Statistical analyses were performed by ANOVA (Tukey's Multiple Comparison Test) (A) and Fisher's exact probability test (B). * P < 0.05, **P < 0.01, ***P < 0.001.

