Figure 5.
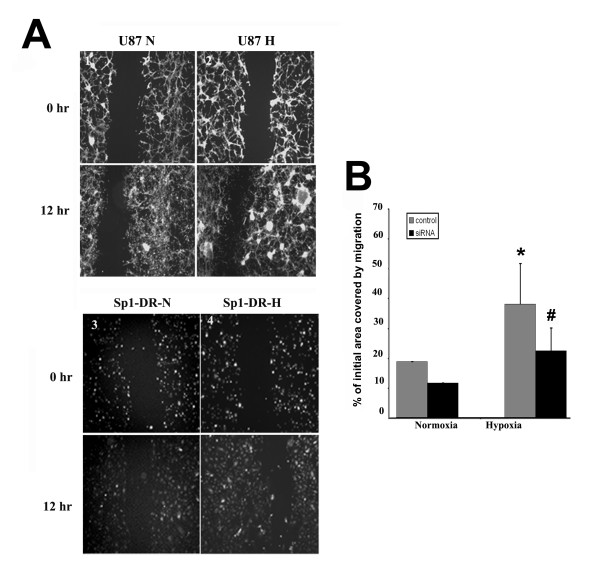
Effect of Sp1 suppression upon migration of U87 tumor cells under normoxic and hypoxic conditions. A. U87 cell migration at 4× objective. N: normoxic incubation, H: hypoxic incubation, 0 hr: zero hour incubation period, 12 hr: twelve hours incubation period, U87: control cells, Sp1-DR: U87 cells expressing Sp1 siRNA. 1. U87 control cells under normoxic conditions. 2. U87 control cells under hypoxic incubation. 3. U87 cells expressing Sp1 siRNA under normoxic conditions. 4. U87 cells expressing Sp1 siRNA under hypoxic conditions. B. Data are shown as percentage of the initial area covered by migration. *P < 0.05 compared to normoxic control. #P < 0.05 compared to hypoxic control.

