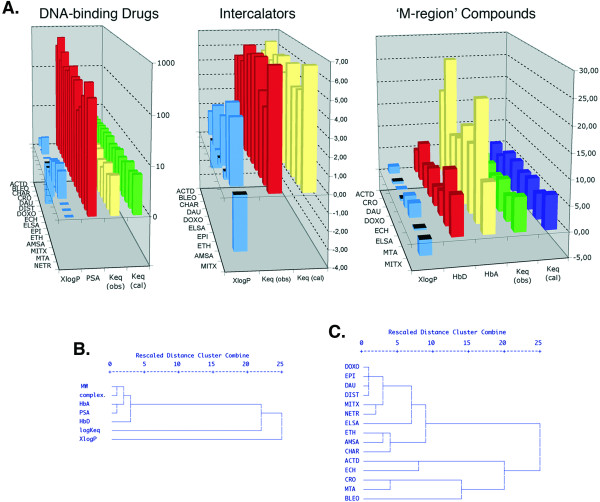
Figure 2.
Common molecular descriptors and noncovalent binding to DNA. (A) Predicted logKeq values obtained by multiple regression analysis using molecular descriptors (Keq (cal)) are plotted together with experimentally calculated values (Keq (cal)) for the complete set of drugs, intercalators and 'M region' compounds respectively. Equations used to calculate logKeq are shown in Table 4. ACT (actinomycin D), BLEO (bleomycin), CHAR (chartreusin), CRO (chromomycin), DAU (daunorubicin), DIST (distamycin), DOXO (doxorubicin), ECH (echinomycin), ELSA (elsamicin A), EPI (epirubicin), ETH (ethidium), AMSA (m-AMSA), MTA (mithramycin A), NETR (netropsin). (B) Dendogram showing average linkage hierarchical clustering of six molecular descriptors for noncovalent DNA-binding drugs, based on the Pearson correlation coefficients. Descriptors with higher similarity are clustered together. (C) Hierarchical clustering applied to the 15 drugs binding reversibly to DNA (Table 1) on the basis of their proximities. Connecting lines further to the right indicate more distance between clusters of either molecular descriptors (B) or drugs (C).

