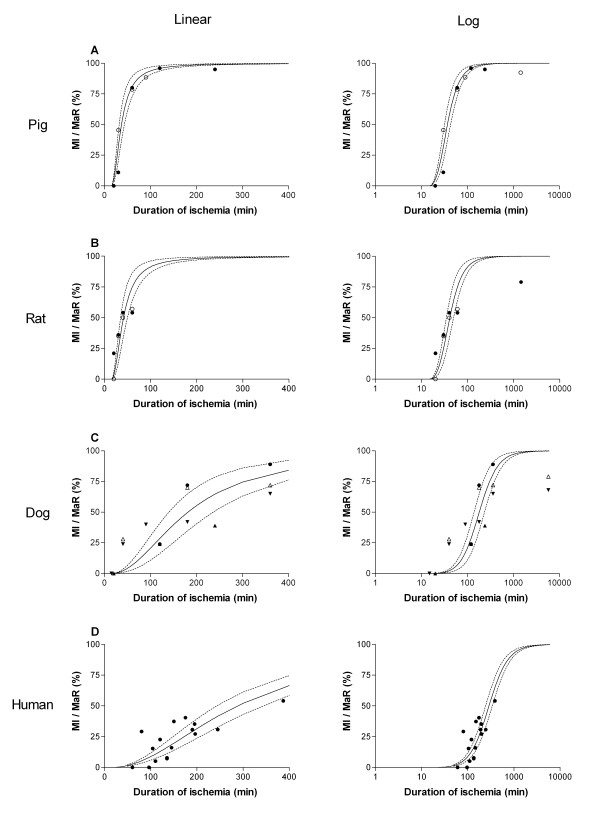
Figure 1.
Myocardial infarct size in relation to myocardium at risk with respect to duration of ischemia in different species. A linear and logarithmic time scale is presented in the left and right panel, respectively. A: Data from previous studies in pigs (black circle = Fujiwara et al [9], white circle = Näslund et al [6]. B: Data from previous studies in rats (black circle = Hale et al [8], white circle Arheden et al [11]). C: Data from previous studies in dogs (white triangle = Reimer et al [3], black circle = Kloner et al [7], upward black triangle = Fujiwara et al [9], downward black triangle = Reimer et al [10]). D: Human data from the present study. The dashed lines represent the 95% confidence intervals. MaR = myocardium at risk; MI = myocardial infarction.

