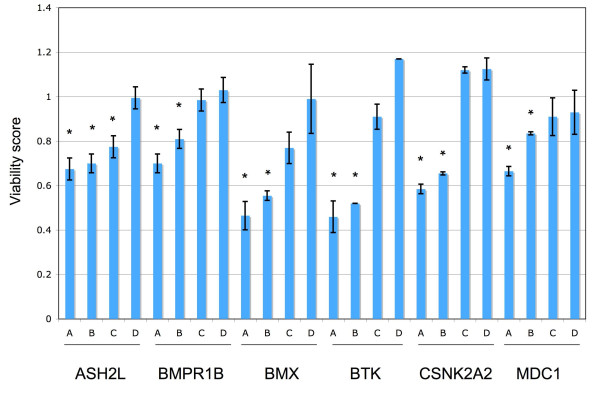
Figure 6.
Cell viability scores of candidate cancer genes in DLD-1. Four siRNA oligos targeting the same gene are labeled as 'A', 'B', 'C' and 'D' for each gene. Each bar shows the mean and standard deviation of the viability scores of two replicated experiments for each siRNA. siRNAs showing significantly decreased viability (p < 0.05) are labeled with '*'.

