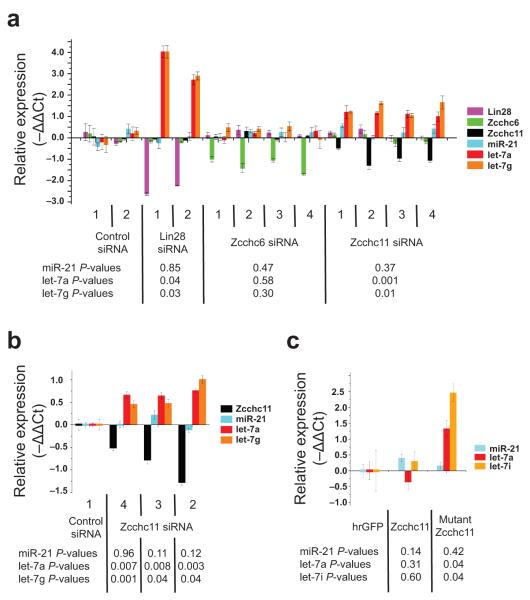
Figure 3. Inhibition of Zcchc11 selectively elevates mature let-7 levels in embryonic cells.
(a) Real-time PCR analysis of mRNA and miRNA levels in response to the indicated siRNA transfection of mouse P19 cells. Data is plotted as −ΔΔCt. Relative fold change equals 2(−ΔΔCt). Positive and negative −ΔΔCt values reflect upregulation and loss, respectively. (b) Knockdown of Zcchc11 in mouse ES cells. Depicted errors bars are ±s.d. (c) Mature microRNA levels upon HA-Zcchc11 and HA-mutant Zcchc11 overexpression in P19 cells. Presented p-values are based on comparisons between control siRNA versus siRNA set for a given gene knockdown. Depicted errors bars are ±s.d.

