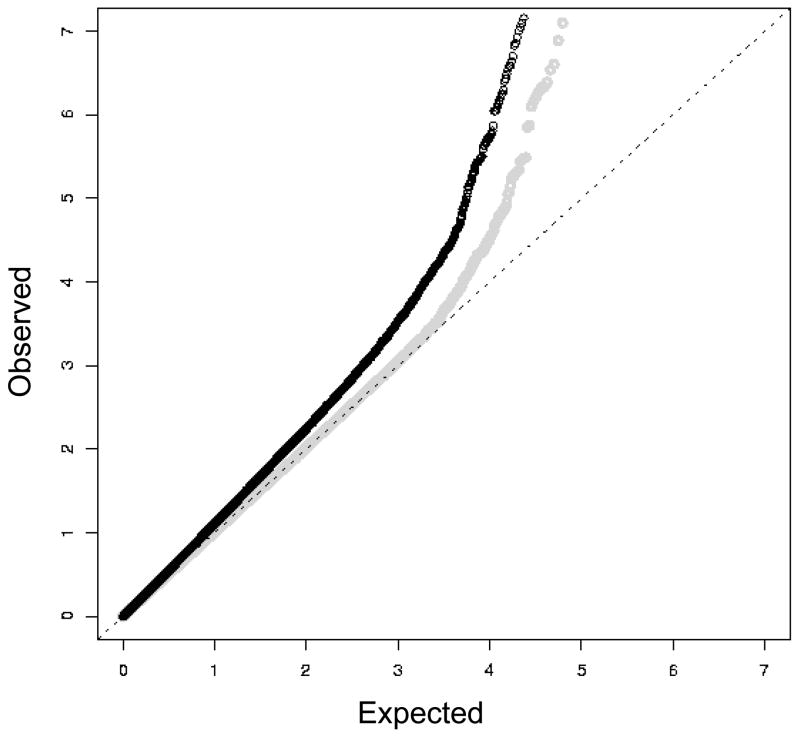
Figure 1.
Quantile-quantile plot of the -log10 p-values from an analysis of the initial GWAS that did not adjust for principal components of genetic variation (black dots) and an analysis that did adjust for the four largest principal components (graydots). P-values smaller than 10−8 are not plotted.

