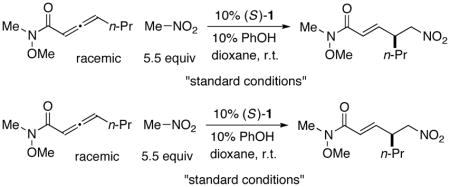
Table 1.
Catalytic asymmetric γ addition of a carbon nucleophile to an allene: Effect of reaction parameters.
 | |||
|---|---|---|---|
| Entry | change from the “standard conditions” | ee (%)a | yield (%)b |
| 1 | none | 93 | 83 |
| 2 | 2 instead of 1 | – | <2 |
| 3 | 3 instead of 1 | 67 | 51 |
| 4 | 4 instead of 1 | 68 | 51 |
| 5 | 5 instead of 1 | −83 | 47 |
| 6 | (S)-MONOPHOS instead of 1 | – | <2 |
| 7 | (R,R)-Et-DUPHOS instead of 1 | – | <2 |
| 8 | (R)-BINAP instead of 1 | – | <2 |
| 9 | quinidine instead of 1 | – | <2 |
| 10 | no PhOH | 74 | 29 |
| 11 | AcOH instead of PhOH | – | <2 |
| 12 | toluene instead of dioxane | 94 | 46 |
| 13 | CH2Cl2 instead of dioxane | 92 | 35 |
| 14 | 1.5 equiv instead of 5.5 equiv of MeNO2 | 94 | 48 |
All data are the average of two experiments.
A negative value for the ee signifies that the enantiomer of the illustrated product is formed preferentially.
The yield was determined by GC analysis with the aid of a calibrated internal standard.
