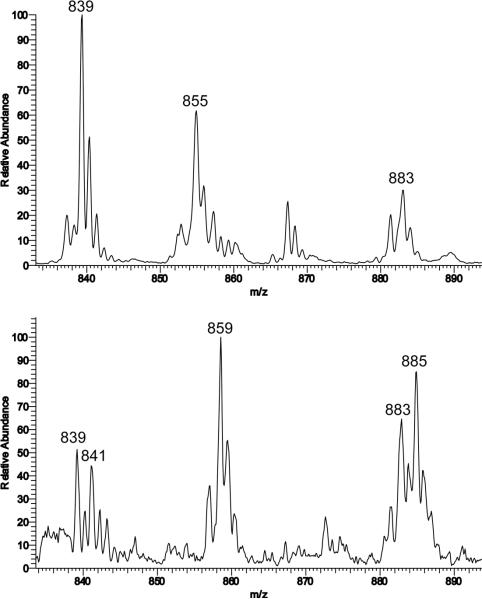
Figure 10.
ESI mass spectrum of 7a at 295 K in CH3CN displaying the isotope patterns for ions at m/z = 855 for {[Fe2(μ-O)(μ-16O2)BPG2 DEV]+H+} (top) and m/z = 859 for for {[Fe2(μ-O)(μ-18O2)BPG22 DEV]+H+} (bottom). The peak m/z = 867 in the upper spectrum can be assigned to a formate-bridged diiron complex [Fe2(μ-O)(μ-O CH)BPG2DEV]+, which is due to the presence of residual formic acid impurities.

