
Fig. 8.
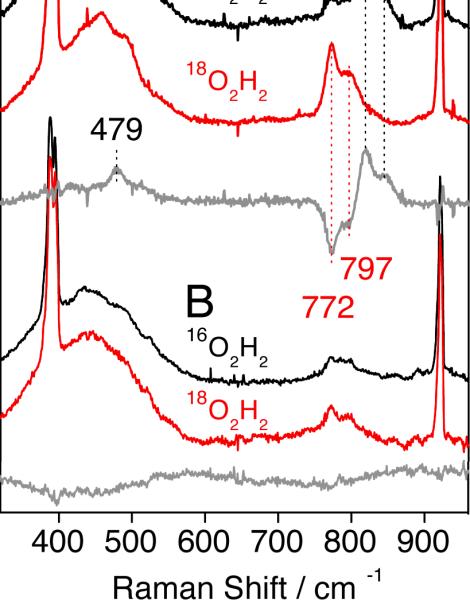
RR spectra of intermediate 6a (A) and its decomposition product (B) obtained with 568-nm excitation at 110 K. Sharp Raman bands below 400 and above 900 cm−1 correspond to solvent vibrations.
Official websites use .gov
A
.gov website belongs to an official
government organization in the United States.
Secure .gov websites use HTTPS
A lock (
) or https:// means you've safely
connected to the .gov website. Share sensitive
information only on official, secure websites.
RR spectra of intermediate 6a (A) and its decomposition product (B) obtained with 568-nm excitation at 110 K. Sharp Raman bands below 400 and above 900 cm−1 correspond to solvent vibrations.