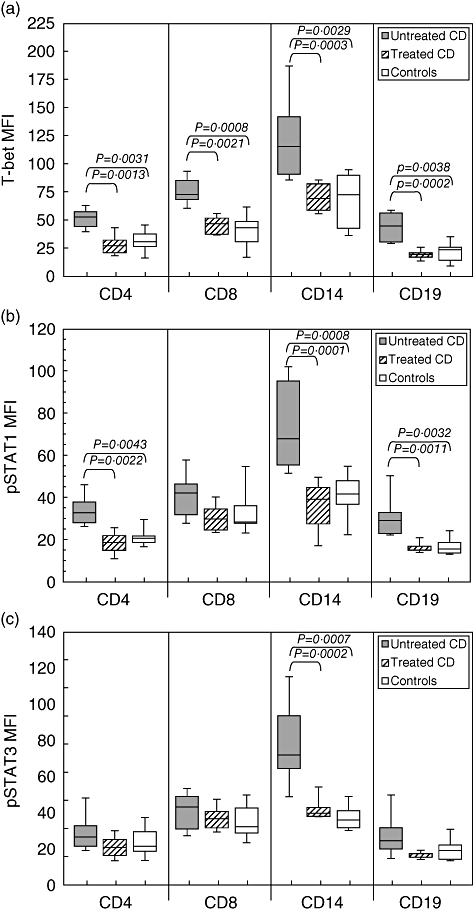
Fig. 1.

Mean expression of T-bet, phosphorylated signal transducers and activators of transcription (pSTAT)1 and pSTAT3 in T, B cells and monocytes from coeliac disease (CD) patients before and after dietary treatment and from healthy subjects. (a) Mean T-bet expression, assessed by flow cytometric analysis as intensity, was significantly higher in CD4+, CD8+ T cells, CD19+ B cells and in monocytes from untreated than from treated CD patients and controls. (b) Mean pSTAT1 expression was significantly higher in CD4+ T cells, CD19+ B cells and monocytes from untreated than from treated CD patients and controls. (c) Mean pSTAT3 expression was significantly higher in monocytes from untreated than from treated CD patients and controls. Box plots express the first (Q1) and third (Q3) quartiles within a given data set by the upper and lower horizontal lines in a rectangular box, in which there is a horizontal line showing the median. The whiskers extend upwards and downwards to the highest or lowest observation within the upper (Q3+1·5 × interquartile range) and lower (Q1-1·5 × interquartile range) limits. P-values indicate statistical significances (< 0·05) between the different groups. MFI: mean fluorescence intensity.
