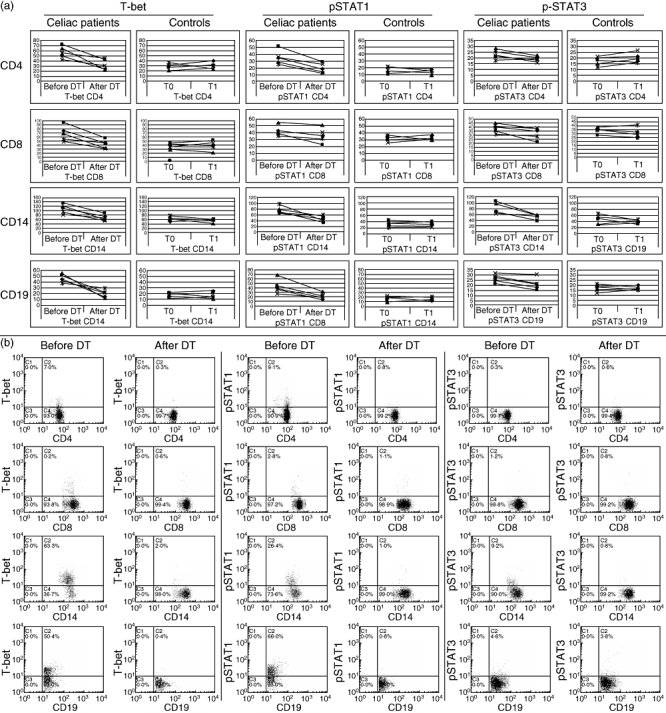
Fig. 3.

Longitudinal expression of T-bet, phosphorylated signal transducers and activators of transcription (pSTAT)1 and pSTAT3 in CD4+, CD8+ T cells, CD14+ monocytes and CD19+ B cells from five coeliac patients before and after dietary treatment. (a) Mean T-bet, pSTAT1, pSTAT3 expression in CD4+, CD8+ T cells, monocytes and B cells from five coeliac patients who we studied longitudinally before and at least after 1 year of dietary treatment. (b) The y-axis of each histogram represents specific fluorescence of T-bet-phycoerythrin (PE), pSTAT1-PE, pSTAT3-PE; the x-axis represents specific fluorescence of extracellular CD4-PE-Cy5, CD8-PE-Cy5 (T lymphocytes), CD19-PE-Cy5 (B lymphocytes), CD14-PE-Cy5 (monocytes) on four-decade logarithmic scales. These representative two-parameter plots are obtained from the same patient before and after dietary treatment. Quadrants were set using appropriate isotype controls for each intra- and extracellular antibody. DT: dietary treatment
