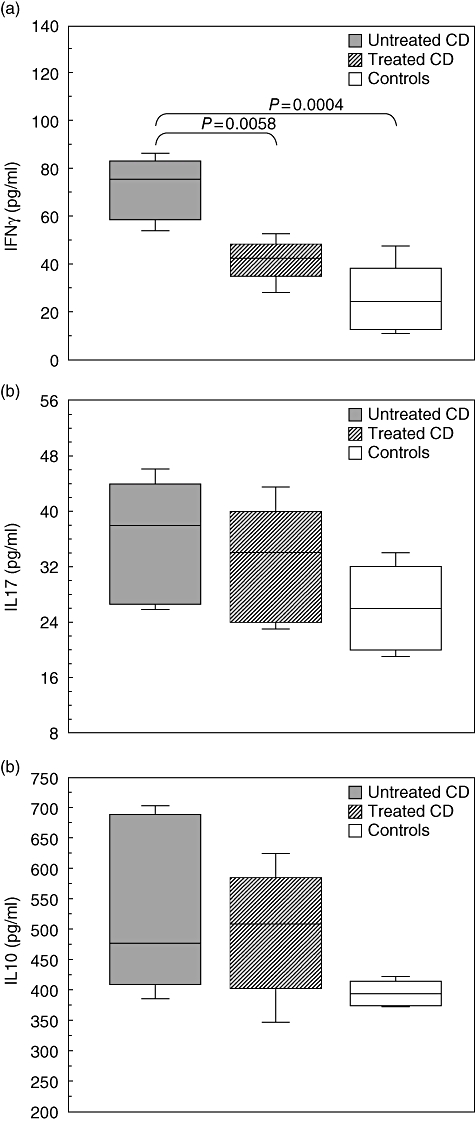
Fig. 4.

Levels of cytokine production by peripheral blood mononuclear cells (PBMC) from coeliac disease (CD) patients before and after dietary treatment and from healthy subjects. (a) Spontaneous interferon (IFN)-γ production was significantly higher in supernatant of PBMC from untreated than from treated CD patients and controls. (b,c) No differences were observed in interleukin (IL)-17 and IL-10 productions by PBMC among treated and untreated CD patients and healthy subjects. Box plots express the first (Q1) and third (Q3) quartiles within a given data set by the upper and lower horizontal lines in a rectangular box, in which there is a horizontal line showing the median. The whiskers extend upwards and downwards to the highest or lowest observation within the upper (Q3+1·5 × interquartile range) and lower (Q1-1·5 × interquartile range) limits. P-values indicate statistical significances (< 0·05) between the different groups.
