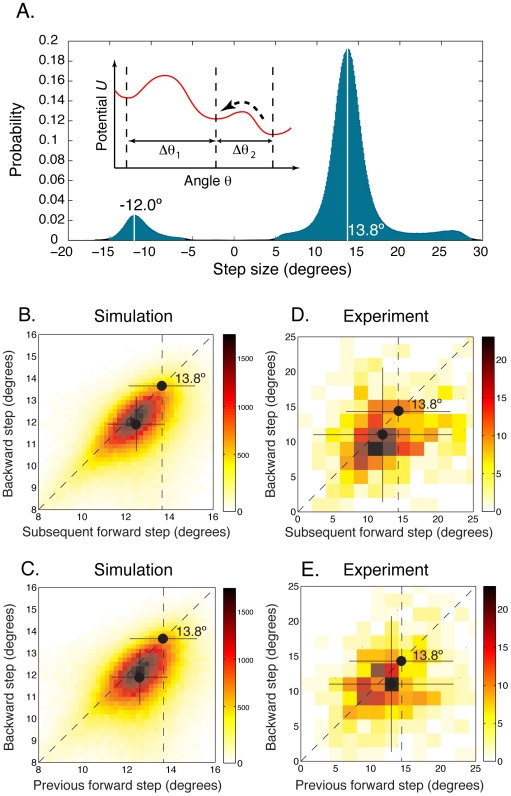
Figure 2. Backward steps are smaller than forward steps.
A. Probability distribution of step sizes using a approximately 26-fold periodic potential (see main text), showing that backward steps are on average smaller than forward steps, in agreement with experiment. Inset: Backward steps rely on low barriers, which occur preferentially where angular steps sizes (e.g.
 ) are small. B–E. Forward steps immediately following or preceding backward steps are found to be smaller on average (
 in the experiment,
  in the model) than the mean of all forward steps (
 in model and experiment, black dots). Crosses denote mean and standard deviation of backward and subsequent or previous forward steps, while black dots and horizontal lines give the mean (
 ) and standard deviations of all forward steps. Note change of scale between simulation and experiment. The experimental data are from [1].

