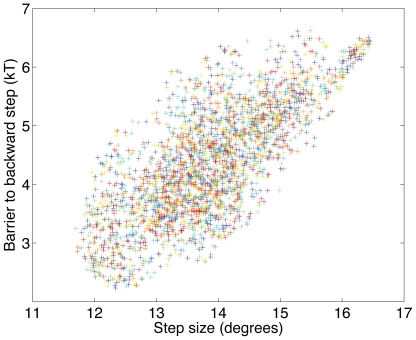
Figure 3. The height of barriers to backward steps is positively correlated with the backward step size.
For 100 randomly generated potentials  , we plotted the size of each of the 26 steps versus the height of the corresponding barrier to backward steps (i.e. the energy difference between the minimum of
  and its immediately preceding maximum). Each color corresponds to a particular potential. We used:
  , with
  , and
, and  drawn uniformly at random with fixed total power
  . The torque is
  .
.

