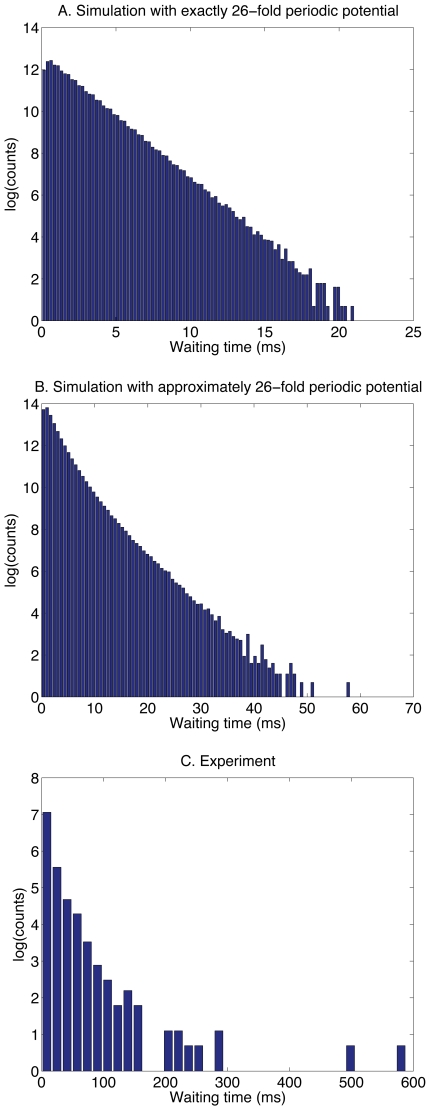
Figure 6. The distribution of waiting times between steps (backward or forward).
A. Simulation with a perfectly 26-fold periodic contact potential  . There is only one type of barrier, and the distribution of waiting times is roughly exponential. (The contact potential is
  with
with  , and torque
  .) B. Simulation with an approximately 26-fold periodic contact potential. There are 26 distinct barriers, each of them having a different characteristic waiting time. The overall waiting time distribution is therefore the sum of 26 exponentials. (The contact potential and torque are the same as in Fig. 2.) C. Experiment – the distribution is consistent with a sum of exponentials.

