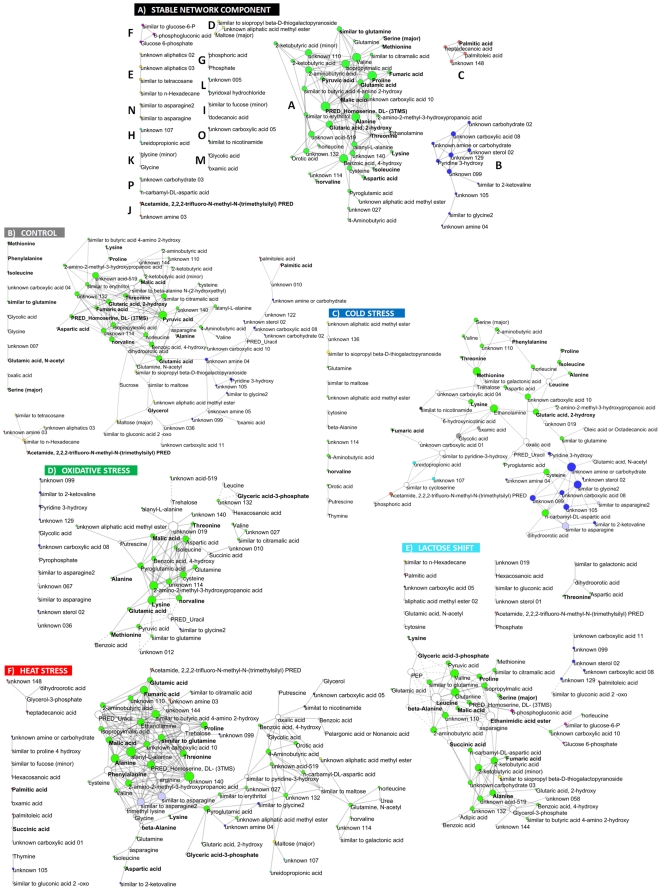
Figure 3. Metabolic correlation networks inferred in the analysis.
(A) Structure of the stable network component composed of all metabolites exhibiting at least one stable correlation and correlations selected as stable using criteria described in text. Each component of the stable network is marked by different color. Size of the node is proportional to its degree. Metabolites exhibiting significant change in concentration in at least one of the applied conditions are marked with bold font face. All components and metabolites with known or approximate chemical structure are listed in table 3. (B–F) Stress specific networks composed of all connected metabolites and correlations specific only for particular condition. Positive correlations are represented by solid edges; negative correlations are represented by dashed edges. Components of the stable network are mapped by node colors. Size of the node is proportional to its stress specific degree. Metabolites exhibiting significant change in concentration in particular condition are marked with bold font face.

