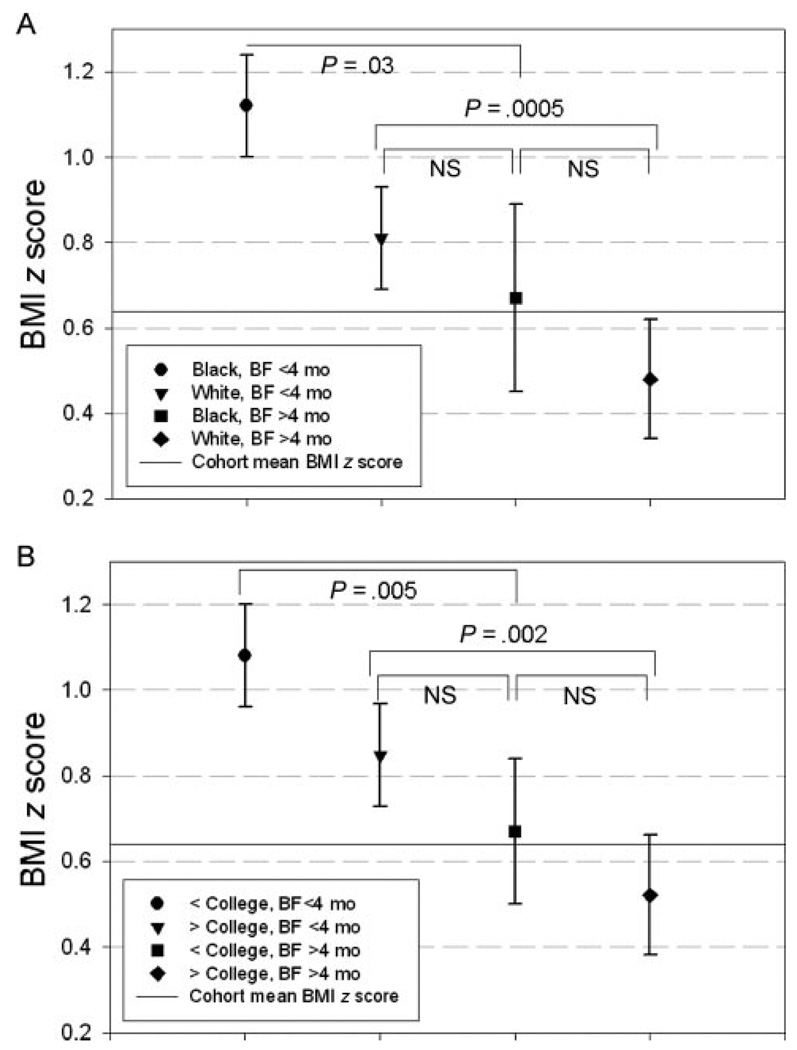
FIGURE 1.
Adjusted least square mean BMI z score ± SE by breastfeeding (BF;>4 months versus all others) and race (A) or parental education (B), from general linear modeling. Both models included race, parental education, breastfeeding for >4 months, gender, age, puberty stage, prematurity, and birth weight. Nonsignificant interactions of race by breastfeeding for >4 months (A) or parent education by breastfeeding for >4 months (B) were included in the model to estimate group-specific least square means.

