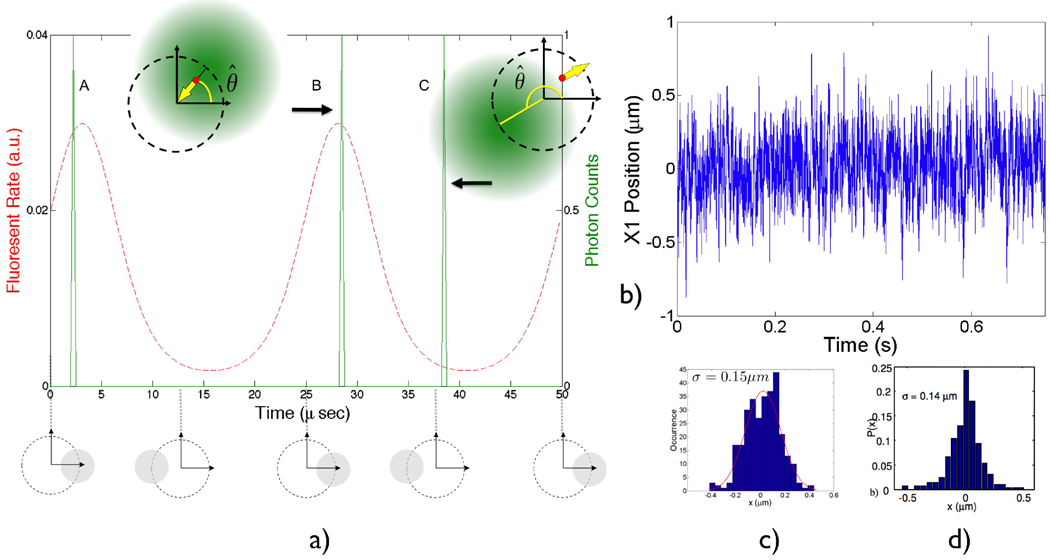
Figure 4.
a) Illustration of the photon-by-photon phase–sensitive detection method. Two rotation periods are shown. The fluorescent particle is fixed at (0.5, 0.5) µm in the trapping plane for illustration. The average fluorescence rate (red, dashed) is the result of the laser spot modulation having peaks at 45 degrees of phase. The actual photons detected (A, B and C, green, solid) are a Poisson realization of the modulated fluorescence rate (assuming nominal count rate of 1 photon per cycle). The resulting feedback forces (yellow arrow) of cases B and C are also shown, where photon C is the “noisy” photon that tends to push the particle away from the trapping center. θ̂ is the estimated phase. b) Simulated trace (along one coordinate) of trapping a single molecule of the prokaryotic chaperonin GroEL in water (D=21µm2/s). The nominal fluorescence rate is set to 28kHz in the linear region to approximate experimental conditions where the photon counting rate drops from 40kHz to 10kHz during photo-bleaching steps [3], and the background count rate is set to 1kHz. c) Position histogram of the simulated trace (averaged over 2.5ms, see text). d) Experimental data from trapping single GroEL in the ABEL trap [14]. The position histogram is extracted from the trajectory of video images.

