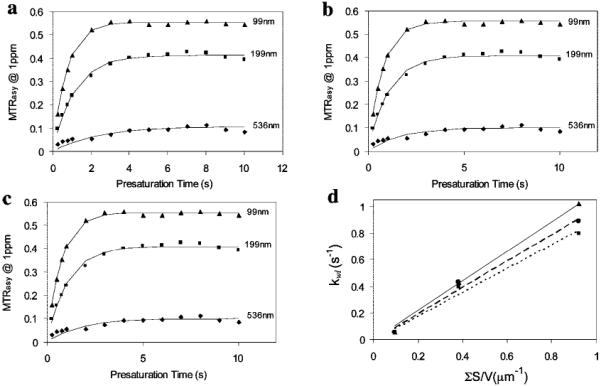
Figure 4.

MTRasy at 1 ppm measured with respect to the presaturation time Tsat for the three liposome sizes each containing 200 mM TmDOTA. The data are analyzed by three methods: (a) method (i), using eqs 5 and 6 to fit for kwl and α and obtaining T1w from the fitted value of kwl; (b) method (ii), using eqs 5 and 7 to fit for kwl and T1w and obtaining α from these fitted values; (c) method (iii), fitting for kwl and T1w by numerically solving Bloch equations and obtaining α from these fitted values. (d) Linear regression analyses of the exchange rates from method (i) (•, dashed line), method (ii) (■, dotted line), method (iii) (▲, solid line) versus the total surface areas per volume. The slope represents the permeability of liposomal membrane according to eq 4.
