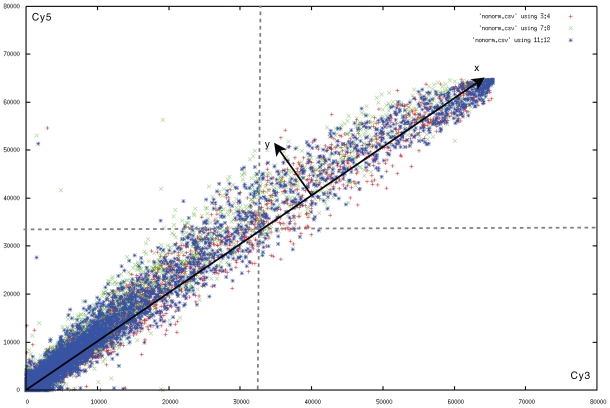
Figure 1.
Scatterplot of the control slides and the two measurements of the MK5 experiments. The red points are from slide 1. The green points are from slide 3. The blue points are from the control slide. Horizontally the red channel is set out, vertically the green. The bend is due to quenching (Kubista, 1994). The variance of the control slide can be observed in the width of the blue area. It increases up to 32768 (indicated with gray dotted lines), after which it decreases again. In a perfect world, the control sample should have the same red as green value, and be a straight line.

