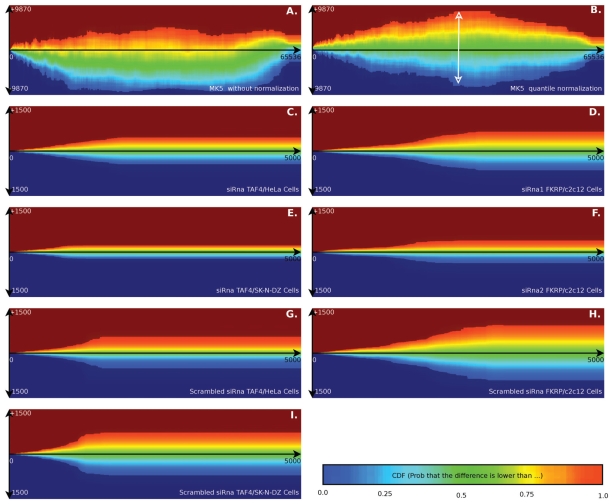
Figure 2.
Error Distribution of various up/down regulation experiments. Horizontally the spot intensity is set out. Vertically the measurement error is set out as a cumulative distribution function. The cumulative distribution expresses the probability that a specific difference will occur due to experimental, biological or measurement variations. The colors are more intense within the 95% confidence interval. With such a diagram one can to determine the limits in which a regulation is very likely to fall. The multiple diagrams are measurement errors obtained from different experiments and different machines. The MK5 sample was Cy5/Cy3 stained and scanned on a Tecan scanner. All other samples were DIG labeled and scanned on an Applied Biosystems 1700 microarray scanner. As an example how to read the diagrams: in the MK5 diagram (top right) we find that the biological variation is larger for spots with intensity 32768. If a measured spot has intensity 32768, then its 95% confidence interval on the difference between the two channels is around[−9000, 9000] (marked with a white arrow).

