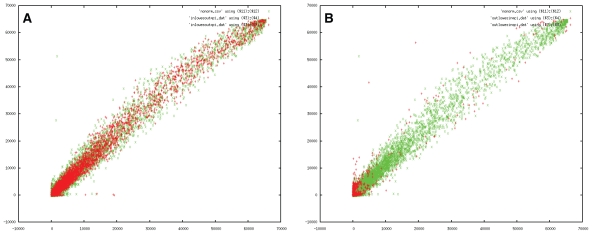
Figure 3.
Plots illustrating the difference between standard filtered results (based on loess normalization and a consensus for both slides) and the filtering based on the confidence intervals for the MK5 experiment. A) the red spots are reported by the standard method but no longer by the confidence interval method. The green spots are the control slide, illustrating the large variance of the measurement. All spots omitted in the confidence interval method were too close to the measurement error to be useful. B) The red spots are those reported in the confidence interval method but not in the standard analysis. The green spots again represent the control slide.

