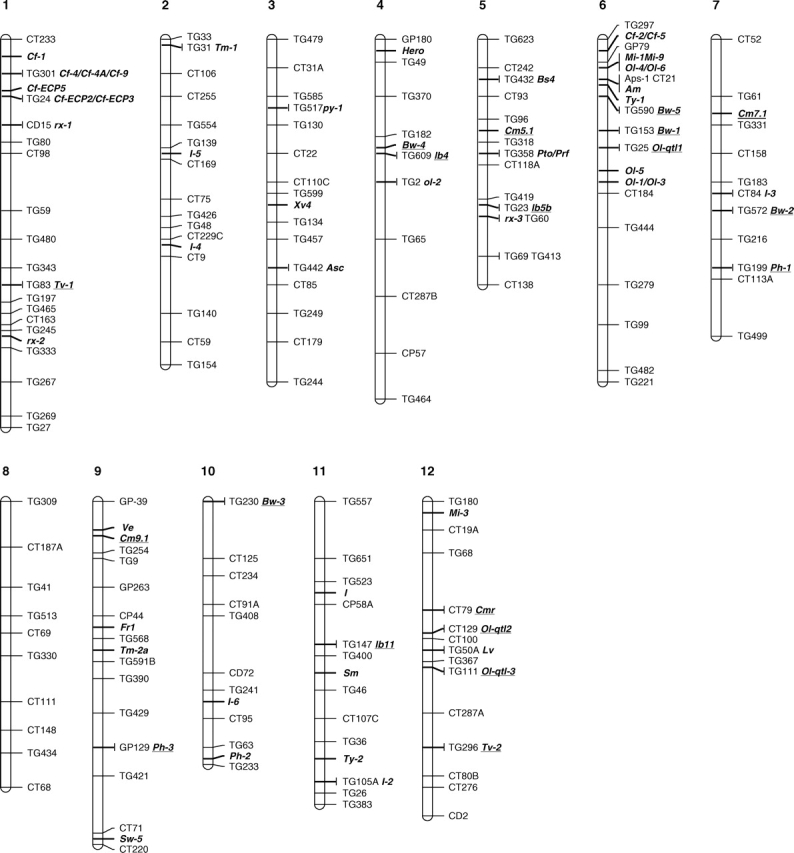
Fig. 2.

Overview of mapped resistance genes and QTLs (quantitative trait loci) on the tomato genome. Marker loci are taken from the core FRLP map of Tanksley et al. (1992). Resistance genes and QTLs are printed in bold and italics with QTLs underlined. This figure is from Bai and Lindhout (2005).
