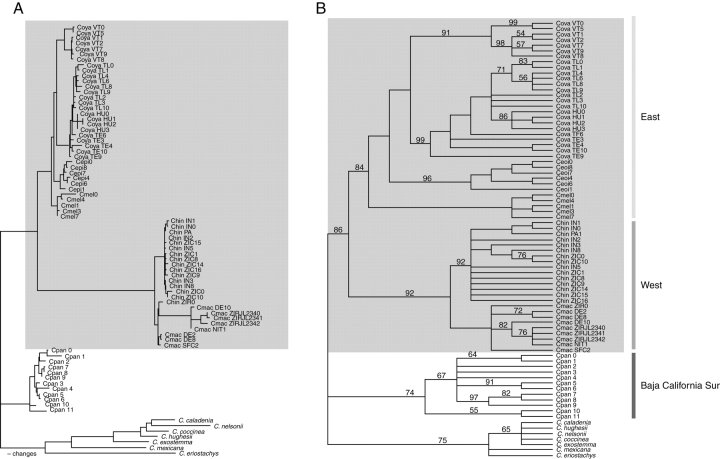
Fig. 2.
Trees produced by simultaneous analysis of sequences from all four plastid DNA regions. (A) One of the most-parsimonious trees showing the number of changes for the Caesalpinia hintonii complex based on accD-psaI, trnL, trnL-F and, trnH-psaI plastid regions including indels (DELTRAN optimization). (B) Strict consensus tree of all equally most-parsimonious trees found in the 1000 replicates of random taxon-addition; numbers above branches are bootstrap percentages >50. The C. hintonii complex is in a grey square. The abbreviations are given in Table 1.

