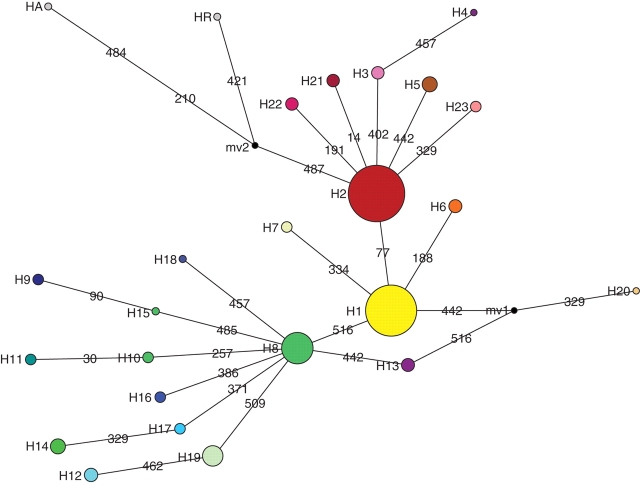
Fig. 2.
MJ network analysis of the relationships between haplotypes of the psbC/trnS3 (524 pb) plastid DNA region from 175 H. stigonocarpa individuals and two outgroups (HA and HR). Circle area is proportional to haplotype frequency and colours are as in Fig. 1. Lines drawn between haplotypes represent mutation events identified by the numbers corresponding to the positions at which the mutations were observed. Black points represent hypothetical haplotypes (median vector).

