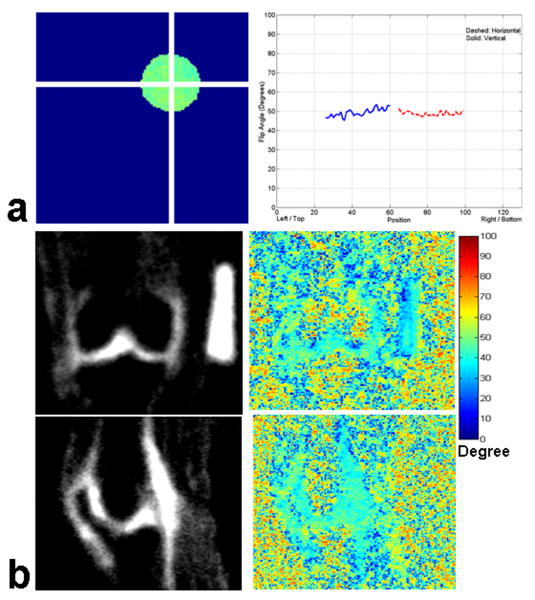
Fig. 3.
(a) Representative flip angle maps of the 4% agarose gel phantom filled with 300 mM/L NaCl and profile plots of the flip angle along the horizontal and vertical directions, and (b) human knee in the coronal and sagittal orientations, respectively. There is less than a 5% variation in flip angle distribution for the agarose phantom and human knee sodium MR imaging at 7T.

