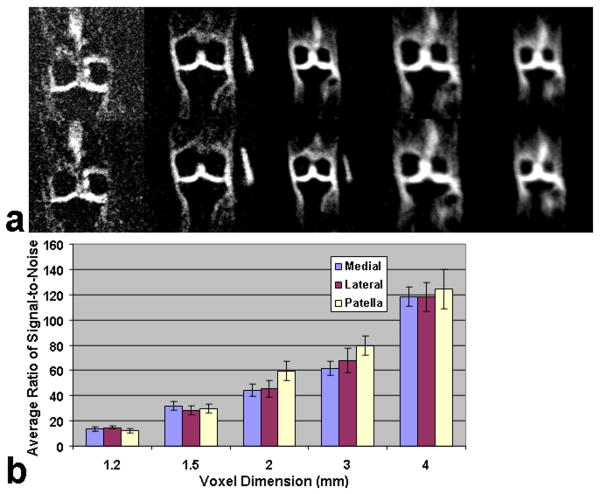
Fig. 4.
(a) Representative sodium images in the coronal orientation at 7T with variable resolution from 1.2 mm to 4 mm. The numbers of averages were 10, 10, 10, 10, and 5, respectively. (b) Corresponding bar charts of measured average SNR as a function of voxel dimension within the three sub-regions of medial-lateral femoral tibial cartilage, and patellar cartilage of human cartilage. Error bars show the standard deviation (SD) of measurement.

