Fig. 6.
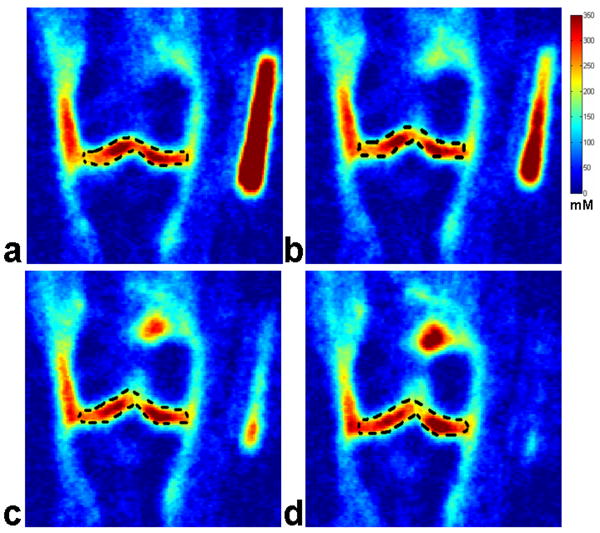
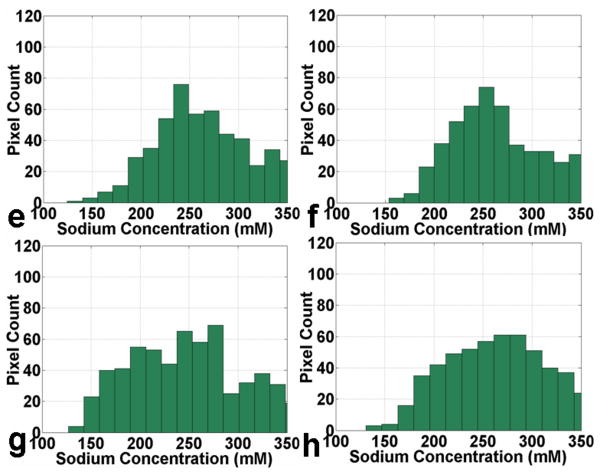
Fig. 6(A): Four representative consecutive sodium concentration maps (a - d) of human cartilage in coronal plane at 7T with isotropic resolution of 1.5 mm from a healthy control.
Fig. 6(B): The corresponding histograms (e - h) of pixel concentration in the femoral-tibial medial and femoral-tibial lateral sub-regions of cartilage as depicted in the manually drawn regions of interest (ROIs) using a dark dashed contour on the sodium images in Fig. 6(A) (a - d).


