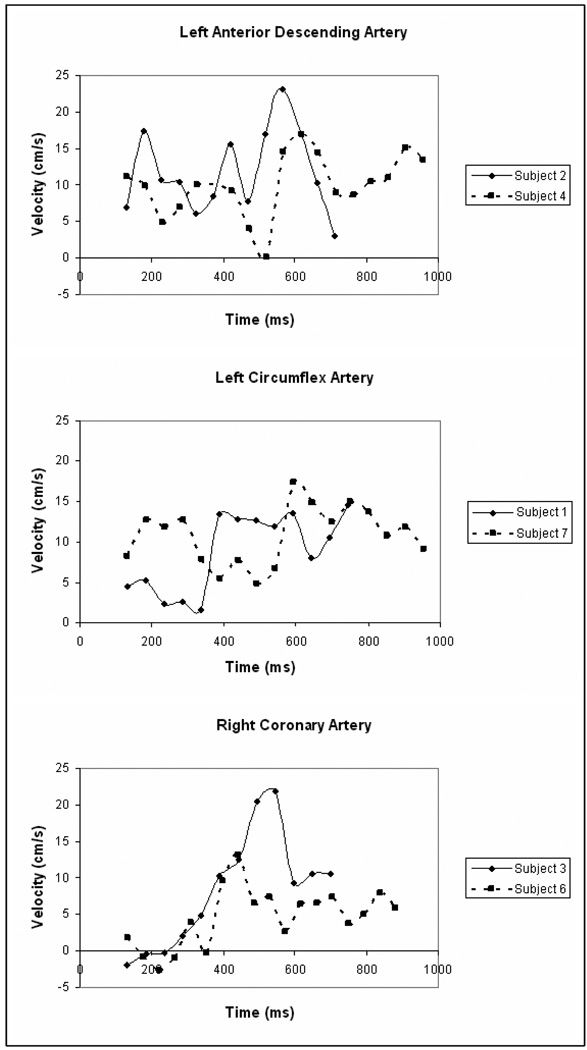
Figure 5.
Blood flow velocity curves in the LAD, LCX, and RCA of healthy volunteers. Multiple subjects are shown to illustrate intersubject variance in pattern and amplitude of velocity curves. Varying length of the curves reflect different heart rates of the subjects. The prospective, navigator echo gating pulse precludes data acquisition over the first 132ms of the cardiac cycle.

