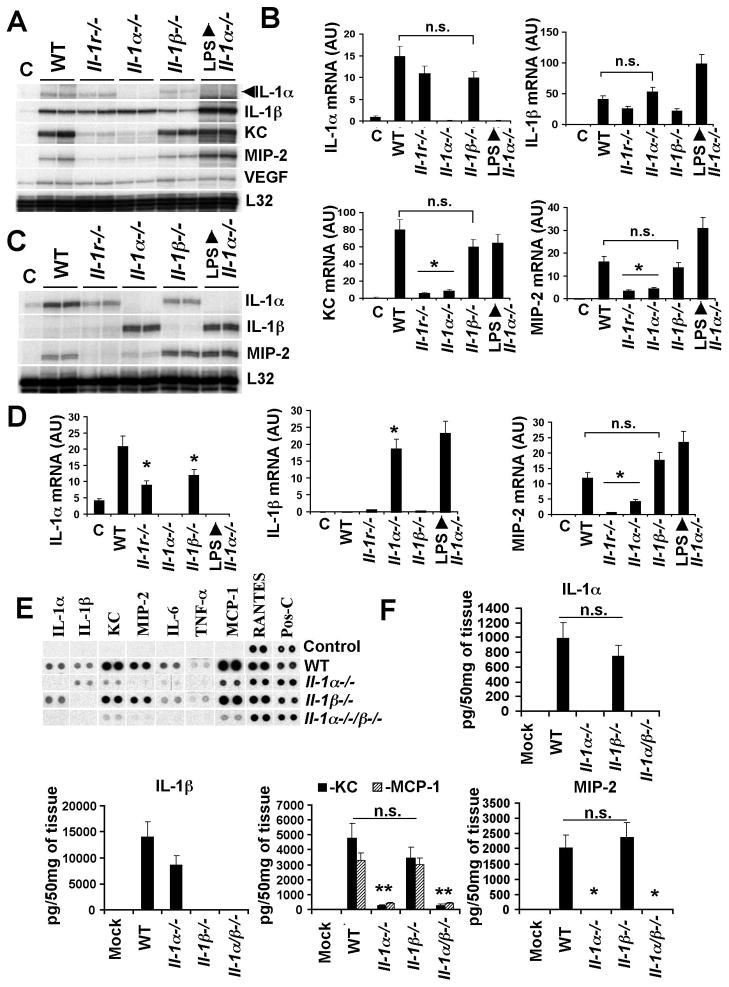
Figure 2. IL-1α is the dominant mediator of an innate immune response to Ad in vivo.
(A) The mRNA levels for IL-1α, IL-1β, KC and MIP-2 in spleens of mice 30 min after Ad injection. Biological duplicates are shown. C – mock-infected mice, injected with saline. (B) Quantitative representation of mRNA levels from the gel shown in (A) after phosphorimager analysis. N=6. n.s. – not statistically significant. * - P < 0.01. AU – arbitrary units. (C) IL-1α, IL-1β, and MIP-2 mRNA levels in livers of mice 30 min after Ad injection. N=3. (D) Quantitative representation of mRNA levels from the gel shown in (C) after phosphorimager analysis. N=6. n.s. – not statistically significant. * - P < 0.01. (E) Protein levels of inflammatory cytokines and chemokines in spleens 1 h after Ad injection. Pos-C are dots that show the manufacturer’s internal positive control samples on the membrane. Control – the spleen protein sample of a mouse injected with saline. (F) The amounts of pro-inflammatory cytokines and chemokines in the spleens of mice 1 hour after Ad injection. N=4. Mock – negative control mice injected with saline. n.s. – not statistically significant. * - P < 0.01.

