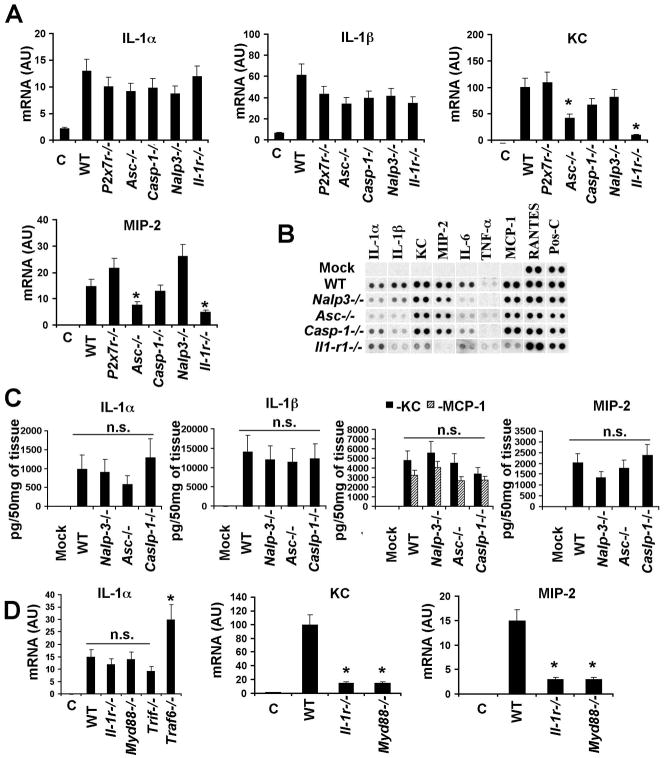
Figure 4. Activation of an IL-1α-mediated innate response to Ad does not depend on NALP3-inflammasome, MyD88, TRIF, or TRAF6.
(A) Mice were injected with Ad and mRNA levels for IL-1α, IL-1β, KC and MIP-2 were analyzed 30 min p.i. N=4. Except for the columns indicated by the star, no statistically significant differences between experimental groups and WT group were identified (P > 0.05). * - P < 0.01. C – mock-infected mice, treated with saline. AU – arbitrary units. (B) Analysis of proteins in spleens of mice 1 hour after Ad injection. N=4. Mock – negative control mice injected with saline. Pos-C are dots that show the manufacturer’s internal positive control samples on the membrane. (C) The amounts of pro-inflammatory cytokines and chemokines in the spleens of mice 1 hour after Ad injection. N=3. Mock – negative control mice injected with saline. n.s. – no statistically significant difference were identified between WT and gene knockout animals (P > 0.05). (D) IL-1α, MIP-2 and KC mRNA levels in spleens of mice 30 min after Ad injection. N=4. * - P < 0.01. C – mock-infected mice, treated with saline. n.s. - not statistically significant.

